
Unlocking Data Insights: The Future of Semantic Models
If you work in a data team, the most common workflow, once you have a business request, is:
1) Connect to data sources.
2) Model the data to create one or more output tables that will help answer the business questions.
3) Connect the output to some type of data visualization tool to create a dashboard or report that end users will use to access the data.
4) Creating formulas at the visualization layer using the BI tool's preferred language. Usually, you create formulas here that can't be added to the data model without losing flexibility for grouping and filtering data. Ratios are the most common example where you need to aggregate before dividing. If you want your model to allow answering what is the conversion rate by campaign for this month and what is the conversion rate by month for the last 12 months, you need to leave the conversion rate calculation to the BI tool.
5) Depending on the BI tool you have, it may allow you to define relationships between 2 or more tables and make it easier to build charts that use data from multiple tables at the same time.
Here, performance depends on the BI tool's ability to efficiently transform those definitions and relationships into query language.
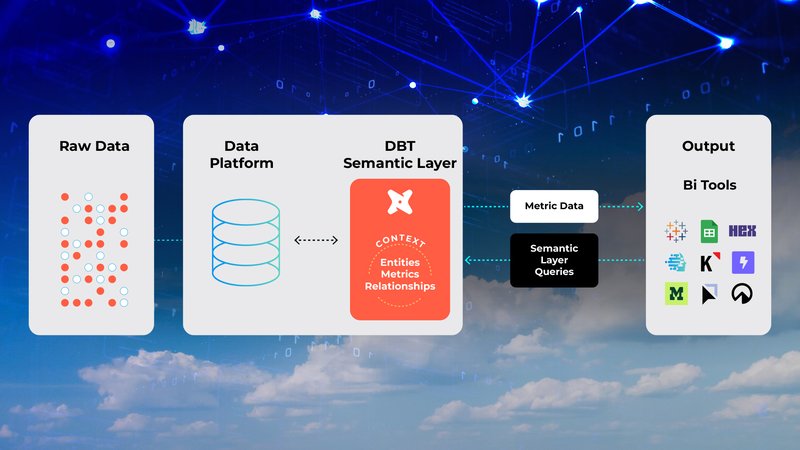
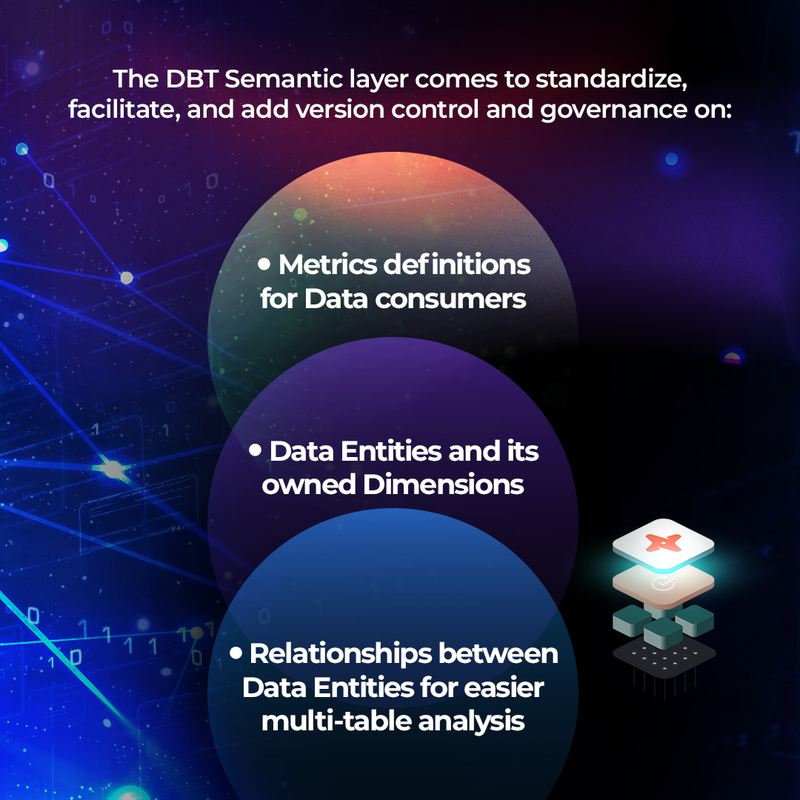
The DBT Semantic layer comes to standardize, facilitate, and add version control and governance on the last 2 items.
You would define these relationships, metrics, and dimensions in DBT, following the same development life cycle you would use for a data model.
You will be able to version control metrics and relationships and keep track of changes very easily.
Finally, you can use the same semantic layer across different analytics platforms.
If your company uses Tableau and Hex, for example, the semantic layer will be available in both for end users to grab metrics and dimensions, but they will be defined in a central location that will keep governance under control.
This would also enable portability. If you want to switch to a different BI platform, you wouldn't need to worry about migrating all those metrics and definitions.
It is still early to see these last benefits because not all BI platforms adopted this new standard yet, but it will happen in the next few years for sure.
Personally, I think the semantic layer arrived just in time for two reasons:
1) The evolution of the Modern Data Stack and the surge of "Analytics Engineering" practices have accelerated the development of data products in companies. Data products are much better, more reliable, and more accessible than before. The problem now is that companies have so much data available that end users get lost and don't know where to look for a specific metric.
The dream of self-service analytics is hard, not because of the technology, but because of data complexities and the constant need to ask the data team: "What data set should I use to calculate X and Y?"
2) With the surge of LLM, data practitioners started to think, what if instead of expecting end users to explore between hundreds of datasets and dashboards to find the answers, we enable a chatbot interface for them to ask a question and let the bot to find the answers for them by searching through all the available information.
Here again, the challenge is not the technology, it is the complexity of the data and the lack of the right context for the LLM.
The definition of a semantic layer would help solve this problem by providing the LLM with a map to navigate the data available. It would also provide a list of all custom business definitions that weren't explicit before other than in a custom field built on the BI tool of choice (or worse, in a cell formula within Excel).
Now, the big question is: How will this impact us, the data practitioners?
A significant change is coming for those working at companies committed to Data Governance and wanting to unlock easy access to insights for the whole organization.
Discussions will shift therefrom:
1) "What do you want to see in this dashboard?" to "How do you define this KPI?"
2) "Who built this chart?" to "What business leader owns the definition of this metric?"
3) "Is this new data source available in a dashboard already?" to "Is this data source mapped to the semantic layer yet?"
4) "We need to add a filter in this chart" to "We need to add a filter to this metric definition" and “We need to add a dimension to this entity”.
5) "What dashboards are impacted when a job fails in the pipeline?" to "What metrics, entities, and dimensions are impacted?".
Apart from this, data modeling will start gaining more importance, and the old discussion about organizing your data effectively in a data warehouse will be back.
Star and Snowflake schemas will probably gain more relevance again as a way to save time on semantic model maintenance efforts.
If you are used to creating big, flattened tables with dimension columns that are repeated across multiple fact tables, it will just make you work harder on the semantic model definitions. It may also generate confusion on LLMs finding multiple tables to answer the same question.

We are looking forward to seeing what 2024 will bring us. Whatever happens, this is just the tip of the iceberg to the changes that are yet to come, and it is exciting to know that we will shape the next set of best practices to make the best use of new technologies.
Dynamic Data