
BI platforms evaluation: Sigma Computing
In this new edition of Business Intelligence software reviews, we bring you Sigma, a spreadsheet-like interface BI solution.
Sigma is an online BI tool for connecting cloud data warehouses intended for Data teams, BI teams, and Business users. Sigma is built with a familiar interface and SaaS architecture to enable a spreadsheet-like interface for exploring and analyzing data and creating visualizations with unlimited cloud data warehouse scale.
Our evaluation

7.5 (out of 10) Once you understand how to interact with the tool, going through a couple of videos and some online documentation reading, you can quickly start setting up your connections, pulling data, and creating a simple dashboard in a couple of hours. For more specialized features utilization, it needs a little more reading, and it's not that intuitive as it seems (filters, drill-downs), but after you catch up, you can keep going.
Its spreadsheet-like UI for datasets makes it very attractive for regular Excel/Google sheets users. For the first part of the evaluation, we put on our "regular user hat". We connected different tables, created some aggregated and calculated columns, and tested some visualizations. All that was pretty straightforward’s, more if you have had some interactions with spreadsheets without using a single SQL line. Then we tried out some more sophisticated stuff like SQL queries, more developed workbooks, filters and parameters, drill-downs, and so on, and we were able to accomplish all of our tasks.
Sigma revolves around the workbook construct, which is a way to integrate data sources and dashboards in a single and related space.
Three features that we loved the most: First of all, you can have a draft version of your workbooks and go to any versions at any time in the past. Then, you have the possibility to define datasets that can be reused anywhere and also have visualizations that can be reused in different workbooks. And in third place, you can materialize your datasets straight to your database if you need some quick model or speed up some queries. A dbt-like simple tool integrated if you want.
We've tested some different data sources, and they responded reasonably quickly when querying. The speed development has been a real improvement since their previous versions.
In terms of architecture, seemingly every calculation, modeling, and charting are transformed into intricate SQL versions of what you need and run through the DB engine. In this sense, it behaves similarly to Tableau. We also found the filters and parameters slightly complicated to use at first interactions. Render filters can take a long time if your source is huge (your underlying SQL can be filtered out using parameters). When using millions of rows, the tool froze a handful of times which can be annoying if you made mistakes setting up a visualization.
In a nutshell, it's an excellent tool, even more for non-SQL users. We believe it’s always better to have your data modeled in your DW and avoid exposing huge tables or creating too complicated formulas on the visualization layer. Since using Sigma is like interacting with spreadsheets, it's a good solution for companies with limited or no BI resources.
Sigma keeps pushing fixes or adding new features apparently by week, which is great.
Features overview
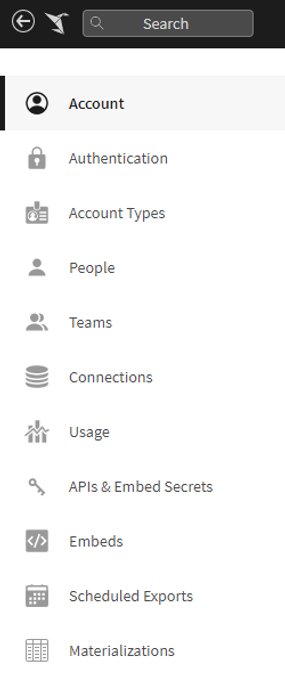
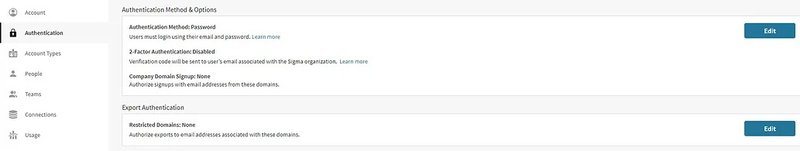
1. Administration
Below you have some screenshots to illustrate how the administration works.
Main menu:
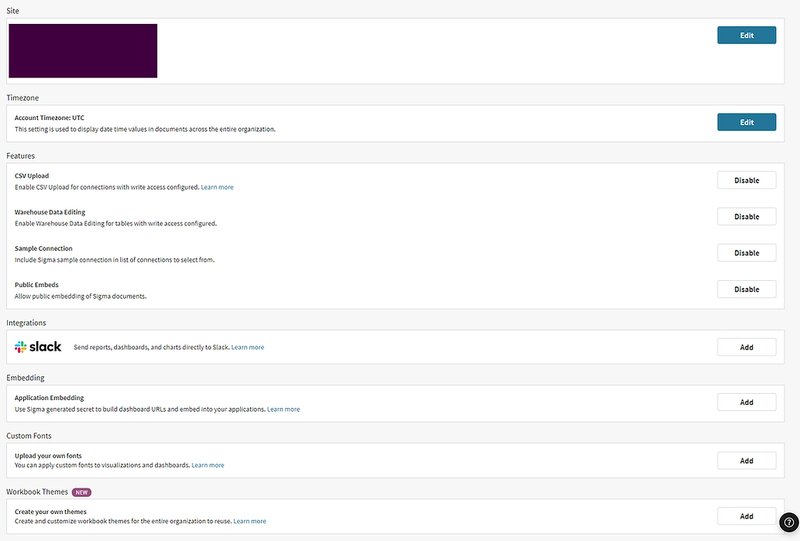
Account:
2. Datasets
Datasets should be a must in every BI software. The ability to create centralized data origins with all its benefits, from easy maintainability and reusability to security. Datasets will be the main feed for workbooks.
Here are a few screenshots regarding the process of creating a dataset. First, select the type of data source you need. If you have chosen SQL type, you’ll see the screen where you'll type the query.
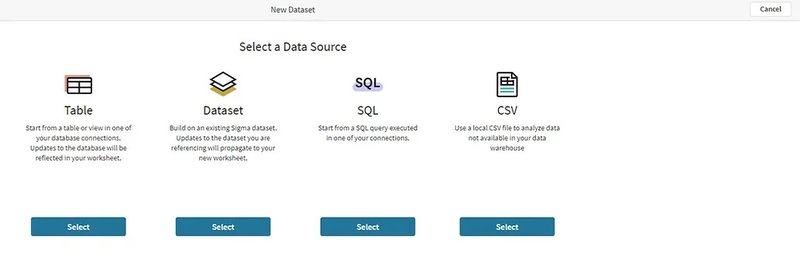
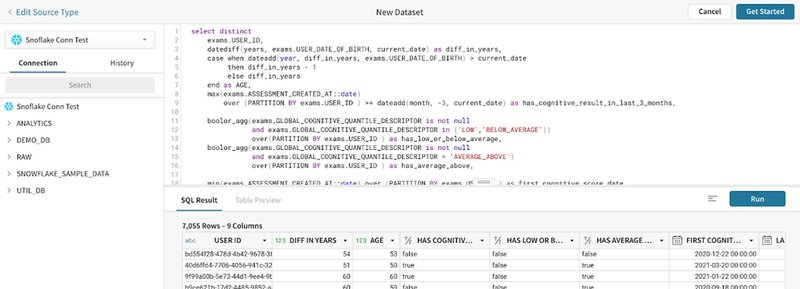
You can create your dataset without a single line of SQL if you're not a SQL-like type of user. You can select a data source Table, CSV, or even a saved dataset you or someone else already created.
Once proceeded with the data source type, you can model your dataset with the tab columns, links, materialization, and grant teams or users permissions over your dataset.
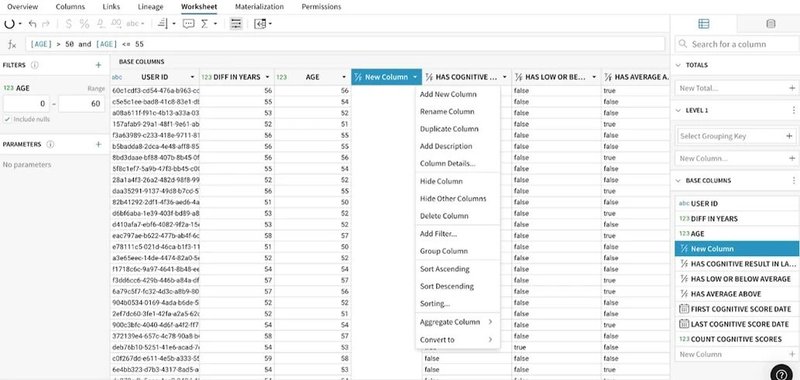
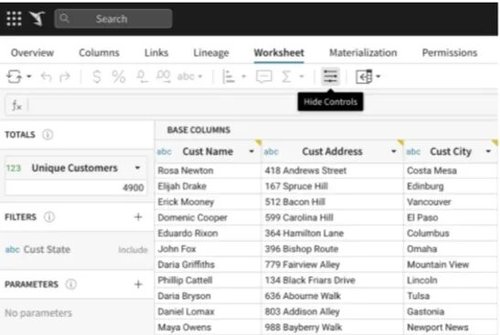
The worksheet section of the dataset allows you to manipulate your data quickly. It is possible to add calculations, levels (groups), filters, parameters, and almost everything worksheets can do. Here relays one of Sigma’s significant features, even more, if you are a spreadsheet user.
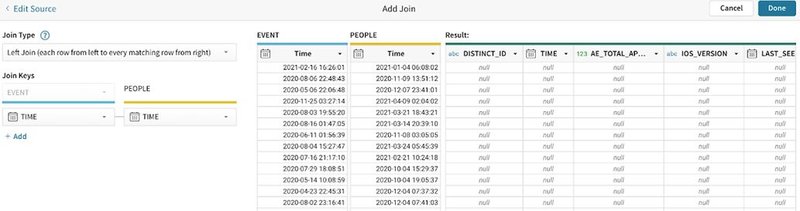
You can create a dataset based on any of the other types of datasets available; as long as those datasets’ underlying connections are the same, you cannot mix different connections. So, you can add more objects from the same origin and define how those objects will relate. This way, you can create joins; for example, editing a join will look like:
When editing or creating a dataset, all interactions in a worksheet are at the column level. Calculations and formats are applied to every row in a column, ensuring consistency.
When you look at a worksheet, you may also see grouping levels represented in the spreadsheet. Creating leveled groups allows you to bundle rows of data based on common characteristics in select columns. You can collapse levels in the spreadsheet for a high-level view of your grouped calculations.
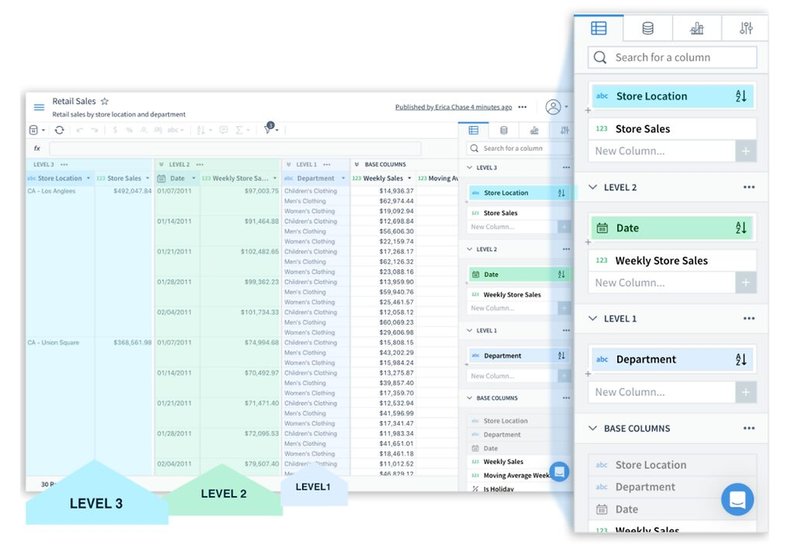
Sigma comes with more than a hundred functions that remind you more like spreadsheet functions than those available in SQL (that's on purpose, of course). Functions are applied at a column-level; you cannot reference cells but the whole column. Type of functions:
- Aggregate
- Date
- Logical
- Math
- Operators
- Pass-Through (Pass-through functions allow you to send a function name and input directly to your database. This makes it possible to use database-specific functions that are otherwise not available through Sigma)
- System
- Text
- Type
- Window
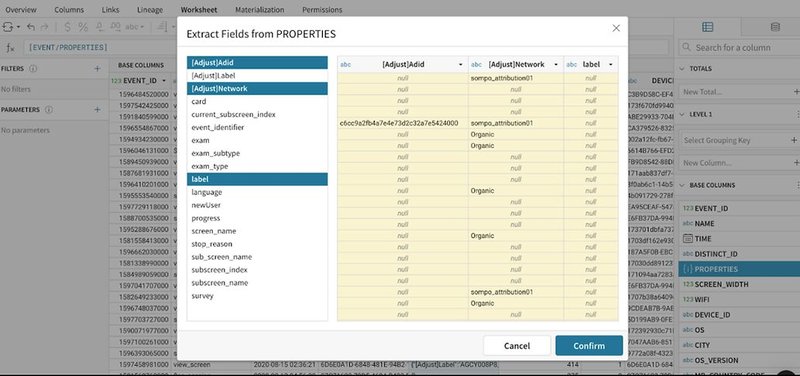
One exciting feature is that you can easily extract semi-structured data. If you have a JSON or Variant column, you can use the ‘Extract Columns’ menu option and select what values inside semi-structured data you need to convert into columns.
On the other hand, one less exciting feature is that every step you take in the UI will generate a new SQL query and hit your data warehouse. Even with such a nice feature like grouping all your visualizations in the same worksheet, every chart you create will have a SQL code behind it that will be executed in your DW.
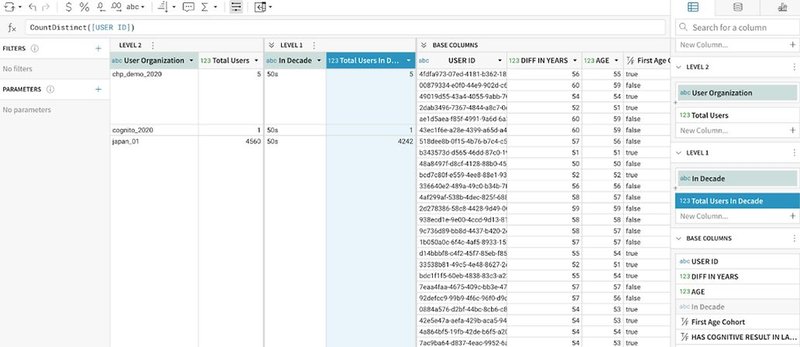
Inside a worksheet, you can manipulate the data to your purposes by just using the UI (no SQL allowed in this instance), including leveling data and all functions available (select the column and type in your transformation in the formula bar). When typing a formula, a typical contextual help will be displayed. Here's an example of how to create levels (grouping data according to any of the available columns):
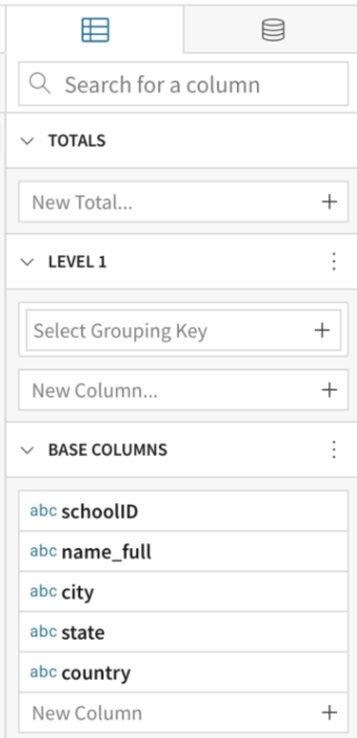
A few features in the worksheet section that give you flexibility in defining the dataset are controls, filters, parameters, and totals. They are situated at both sides of the sheet and are pretty self-explanatory when you see the views:
3. Workbooks
Sigma added this feature on June 1st, 2021.
Workbooks are the place where you start creating your dashboards. This space is meant to have everything you need to start answering questions and exploring your data. Once settle for information that is worth keeping you can create your reports. Sigma has recreated the cumbersome task that was creating worksheets separately as a base for visualizations to building dashboards.
It's interesting how well documented is the new feature with clear guides when you try to create your workbook.
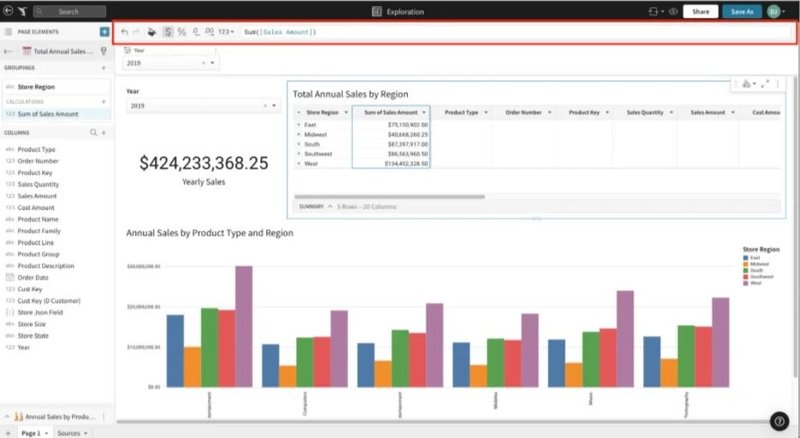
Following, you can see how workbooks look like (one empty and one with several elements):
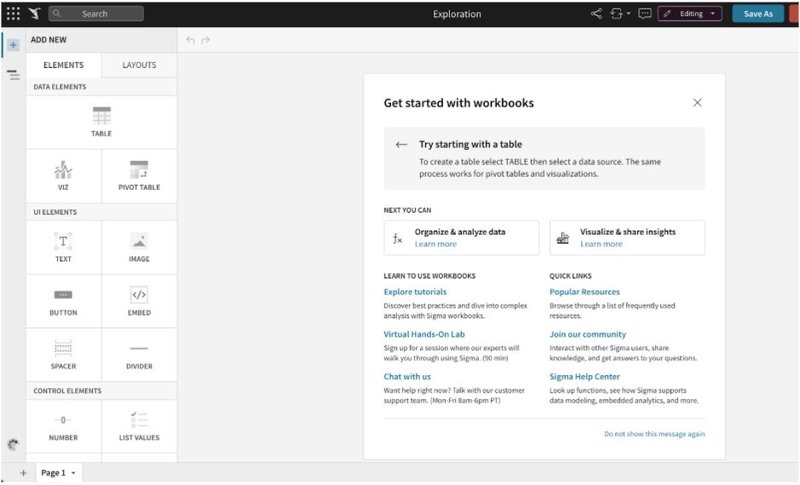
Pages will be a space where you'll build a different dashboard. The editor panel manages all the elements you can add to and customize in your dashboard to the left. You can select many different layouts for each page to start with (predefined layouts) and modify them as you go, or create your design from zero. You cannot save the layout template for future use.
Each page can hold any type of elements: tables (data origin), pivot tables (data origin), controls (like filters), visualizations, text, images, spacers, dividers, embeds, and buttons.
There is a toolbar on the upper side where content changes depending on the element you have selected and allows you to view or edit calculations.
There are three basic element types you can add to a page:
- Data Elements: consists of tables, pivot tables, and visualizations coming directly from the data sources. Every time you select one data element on the page, the editor automatically will show all options for that type, where you can change aggregations, styles, columns, axes, series, labels, etc. Once an element is added to the page, you can create a new element as a child element and choose a different presentation. Every element can be individually filtered using any of seven filters types. Tables and pivot tables are a representation of underlying data sources, and they support most of the traditional spreadsheet's functionalities, like creating calculations and applying filters and formats, data grouping, and summaries. The visualizations available are Bar charts, Line charts, Area charts, Scatter charts, Donut charts, Pie charts, Single value, Funnel charts, Gauge charts, Map, Box, and whisker charts.
- UI Elements: these will give you the ability to customize your dashboard. UI elements available are buttons, dividers, images, spacers, embeds, and text.
- Control Elements: these are elements meant to manipulate all data elements you've added to your page. These are filters and parameters. Filters have different types (Include, Exclude, Range, Date Range, Text Match, Switch, Drill Down), and you will need to define the targets element that will be affected. A parameter is a customizable field that can be added to a workbook and referenced in formulas.
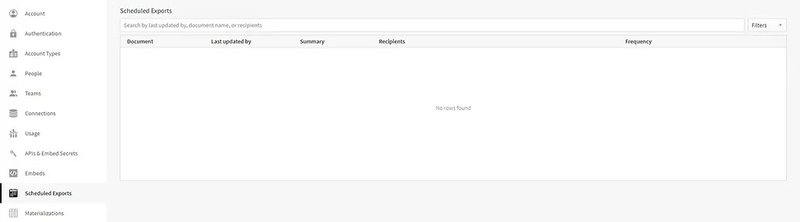
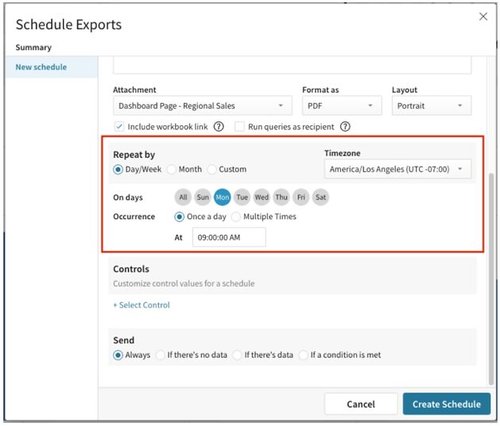
Workbooks, their pages, or elements can be sent via slack or email with possible multiple schedulings or manually at any moment. If you're sending a data type element, you can send a CVS file, excel file, or pdf of the underlying data.
There are also Conditional Schedule Reports (or alerts). Here you need to select the condition to be evaluated at the time of scheduling: If there is or isn’t any data in a selected element, or if a specific column within an element meets a condition.
Example of scheduled report options:
Workbooks, pages, and elements can be also shared with any member of your team; of course, the recipient needs to be a user in Sigma.
You can download data from any data element in your pages. The format available is CSV, Excel, or PNG files.
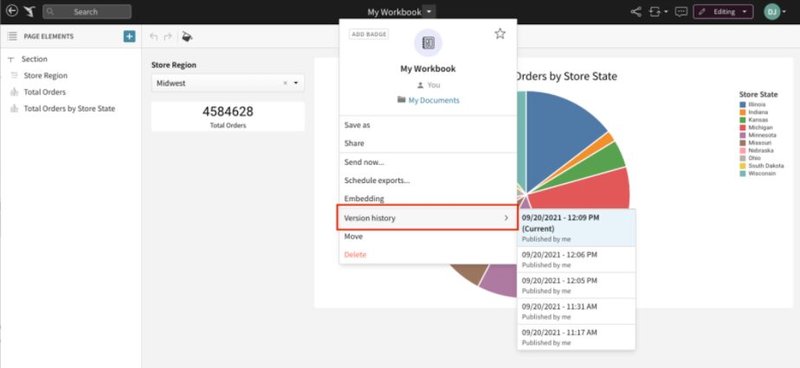
4. Versioning
One exciting feature is the workbook lifecycle, not standard in other BI tools. You can use them with exploration objectives, manipulating sources to answer questions momentarily. You leave without saving, but you can revisit your explorations later and continue your investigations. At any point, you can decide to save the workbook. At this moment, the workbook is on a draft stage holding all your changes. Then you can discard the last modifications or publish the version so anyone with access privilege can view it. After that, you can go into a draft-publish cycle. There's a list of all the published history available you can review, explore and even restore (overriding the current published version).
5. Comments
Any member with access to the workbook, page, or data element, can add a comment requesting feedback, possible changes, discrepancies, etc. You can edit comments, reply to them, mention a colleague, tag a thread as resolved or re-opened. These are great collaboration features.
6. Workbook Row-Level Security
This is nothing fancy, just hidden filters that need to be placed in the workbook targeting all data sources that need to be restricted. Sigma recommends creating a hidden page, adding a source table/dataset there, and filtering members using a couple of internal functions: CurrentUserEmail and CurrentUserInTeam.significant
7. Embedding
Workbooks and dashboards can be embedded in internal or external web pages or applications. Embedding comes in three types: public, private, and application, and it is accomplished through iFrames.
- Public: You can embed workbooks, pages, or single elements and set what controls are visible for the users.
- Private: Only Sigma members can see them. Only workbooks are allowed to be embedded here.
- Application: Workbooks, pages, or elements can be embedded without the need of users to login into Sigma. Here you need the assistance of some code on the server-side to generate a unique and encrypted embedded URL using a secret and set of additional custom parameters. The URL generated can only be used once.
Specs summary
- Tool type
Cloud analytics solution.
- Pricing
The pricing is not openly provided. It's supposed to have a flat fee for using the tool with unlimited view accounts and then a charge for every Author user account.
- Trial
It's available a 14-day trial for companies.
- Supported DW
Only Snowflake, Redshift, BigQuery, and Postgress.
- Releases
According to their notes, they're releasing updates almost weekly.
This finishes our evaluation of Sigma but we are sure we will need to revisit this really soon. The platform is growing rapidly!
Stay tuned for more BI platforms reviews coming soon.
Dynamic Data.